hisAREA

evaluations of environmental data above an area


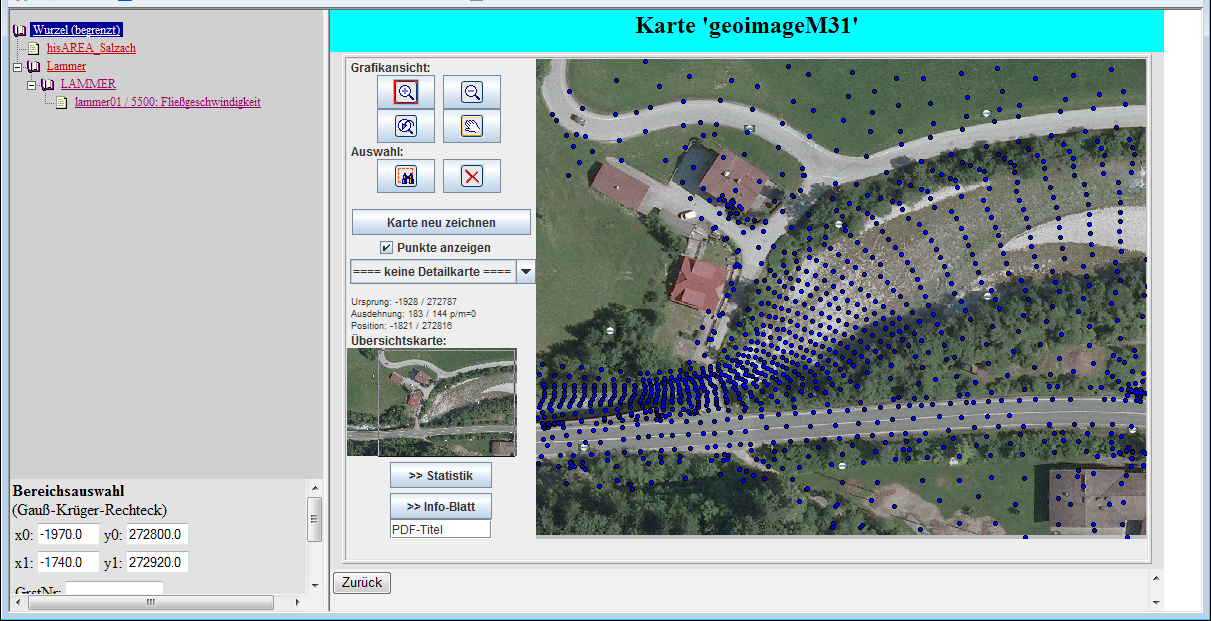
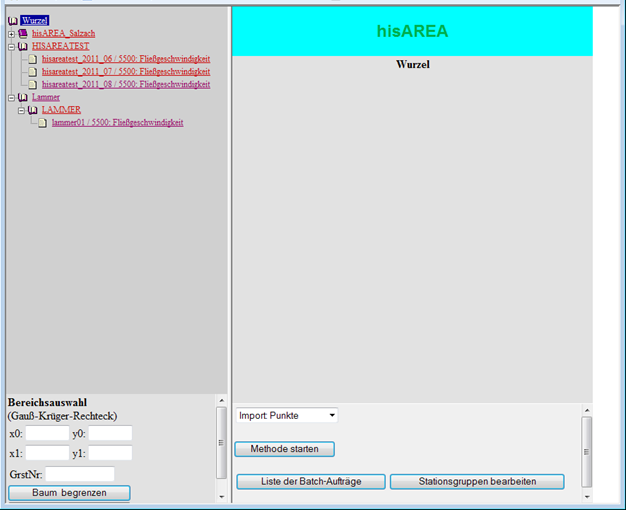
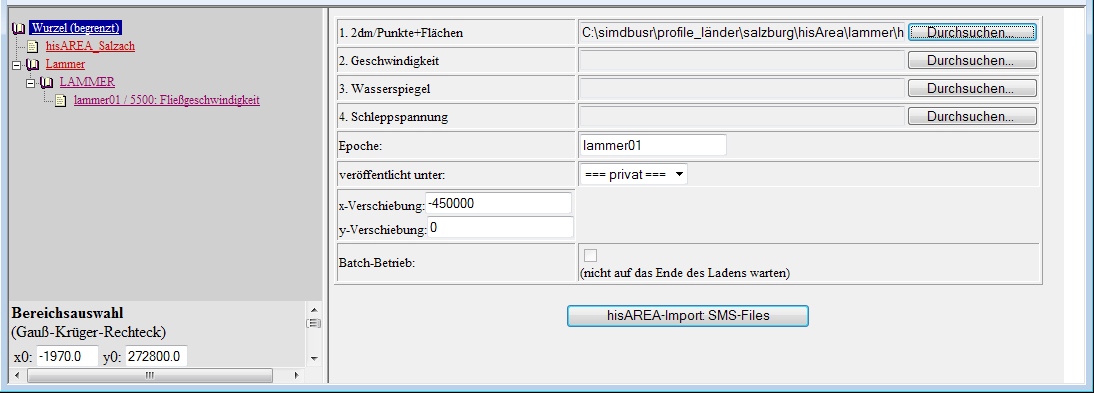
hisAREA is an extension module to his3dIserver. hisAREA goes for data storing, displaying and evaluating of data above an area. Ordinarily these come from studies and researches on:

  • flood incidents
  • pollution load
  • weather situations

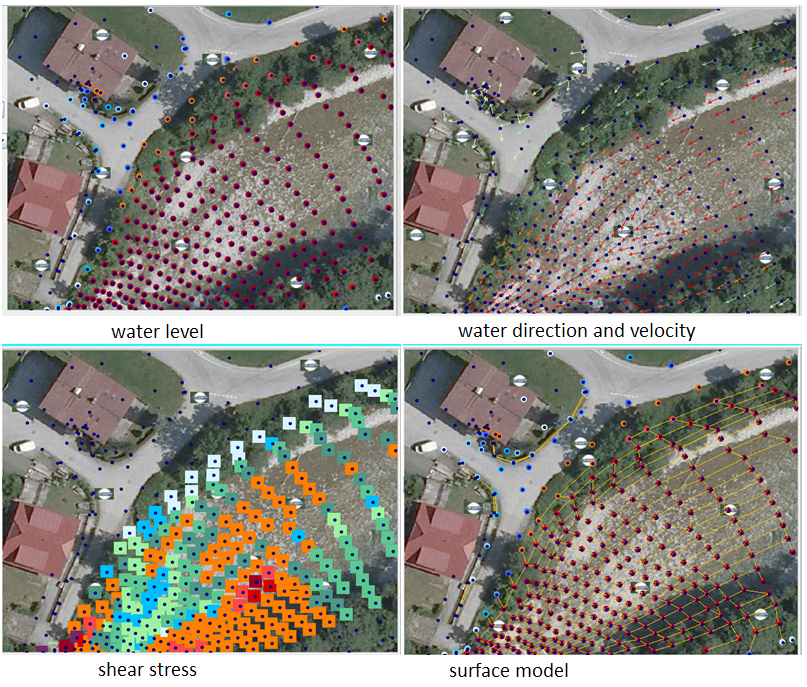
Intensity values, which are distributed above an area, form the data base:

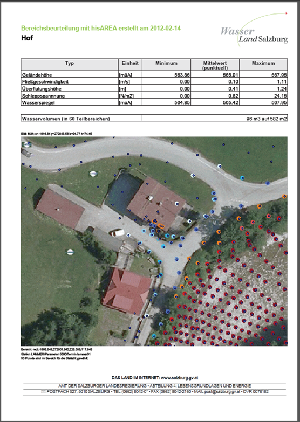
  • location: x, y, height
  • intensity (e.g. water level)
  • flow direction
  • shear stress
  • surface character (roughness value)
hisAREA sample
hisAREA Überblick

Facts

  • storing of model computation results for flood events
    • logical localization
    • quick retrieving
    • fast queries
  • hierarchical presentation in a tree structure
  • methods
    • import
    • export
    • viewer
    • statictical evaluation
  • web based
  • HIS'3D® data base with specialized tables
    • fast 2D-index
  • WMS - web mapping service
    • WMS client (viewer) and
    • WMS server: offers the data values in thematic maps layers


Import

  • general format
    • points
    • surface
  • Blob
    • e.g. simple storing of huge files with computational results
  • Hydro-as-2d / SMS
    • points, surface
    • water level
    • velocity
    • shear stress
  • River-2D
    • loading a .fdb-database

hisAREA Import

Queries

  • hierarchical structure - using an access tree
    • river
    • section of a river
    • section of a study
    • examination (logically: e.g. HQ30, 100, 300)
  • query based on area
    • GK-rectangle
    • number of parcel or property
      • shows only the data values, which are relevant to this area
      • adapted to the land register and cataster of the customer

hisAREA Abfrage

hisAREA Viewer

Viewer

The viewer displays and presents the data in different detail and thematic maps. It features:
  • predefined background map
  • zoom, pan
  • displaying of information for a single point
  • drawing of lines
    • e.g. for building projects
  • direct printing of the current view
  • statistics on selected areas, see below
  • thematic maps for
    • ortho photos
    • surface model
    • water level
      • with "normalized colours"
    • water velocity and direction
    • shear stress
    • further maps using WMS: e.g.
      • plot boundary, danger zones


hisAREA surface model
hisAREA section

Surface Model

The viewer uses alternatively an imported surface model or a model, which has been computed by hisAREA, for local evaluations. The viewer and a special module of the his3dIserver-kernel are both able to compute optionally surface models.

  • his3dIserver
    • computes a surface model for a stored study, e.g. if has not been part of the modelling study
  • viewer
    • computes a new surface model for selected points, locally and temporarily, which is displayed in a separate map layer
    • the surface model is used for
      • computation of terrain sections, specified interactively by the used
      • shading


Statistics

The user interactively selects points, which are used for the statistics. The statistics are computed for the selected scenario or for all sceneries, which belong to this geographical area. Output is:

  • a statistic in the browser or
  • a data sheet based on a predefined pattern (pdf-foramt, adapted for the customer).

hisAREA HTML Statistik hisAREA PDF Statistik


Data statement:
The data displayed does not belong to a real scenario.


Use the info-form to request further information.

Home
Copyright Simutech 2014
Mail an den Webmaster